
Pinterest analytics is the free dashboard in a Pinterest business account that shows how often your pins were seen (impressions), what people did with them (saves, pin clicks, outbound clicks) and who saw them (total and engaged audience). For website traffic, watch outbound clicks and outbound click rate. For reach, watch impressions and saves, and always compare against your own average rather than someone else's.
What is Pinterest analytics?
Pinterest analytics is the built-in report that shows how your pins perform: how often they were seen, how many people saved or clicked them, and how many clicks went to your website. It's free, and it only comes with a business account.
If you're on a personal account, you won't see it. Switching to business is free, keeps your boards and followers, and takes a couple of minutes. Our Pinterest business account guide walks through the switch and the settings worth doing at the same time, like claiming your website.
Your Pinterest analytics history starts the day you switch. Older data isn't filled in, so switch early.
How to see Pinterest analytics on desktop and the app
On a computer, open the menu at the top left and choose Analytics, then Overview. On the Pinterest app (iPhone or Android), tap your profile picture, then the small chart icon at the top of your profile, then Analytics.
Here are the steps in order, based on Pinterest's own analytics help page:
- Log in to your business account at pinterest.com.
- Click the menu icon (three lines) at the top left.
- Under Analytics, click Overview. You'll see the last 30 days by default.
- On the app, tap your profile picture at the bottom right, tap the chart icon at the top of your profile, and choose Analytics.
- To see one pin's numbers, open your profile, tap Created, open the pin and tap Pin stats (or See more stats on desktop).
The app is fine for a quick look, but exporting, comparing audiences and age and gender filters only work in a browser. Use a computer for your monthly review.
Pinterest analytics explained: every metric in plain words
Every metric in Pinterest analytics is either a count (how many times something happened) or a rate (that count divided by impressions). Once you know that, the dashboard gets a lot less confusing.
Here's what each one means, using Pinterest's current definitions:
| Metric | What it means | What it tells you |
|---|---|---|
| Impressions | How many times your pins were on screen | Reach: is Pinterest showing your pins? |
| Engagements | All actions on your pins: saves, pin clicks, outbound clicks, carousel swipes and similar clicks | Overall interest |
| Engagement rate | Engagements divided by impressions | How interesting your pins are to the people who see them |
| Saves | How many times people saved your pin to a board | Long-term value: saved pins get shown again |
| Save rate | Saves divided by impressions | How save-worthy your pins are |
| Pin clicks | Clicks that open your pin in close-up | Curiosity: people wanted a closer look |
| Pin click rate | Pin clicks divided by impressions | How well the image grabs attention |
| Outbound clicks | Clicks that take people off Pinterest to your link | Website traffic |
| Outbound click rate | Outbound clicks divided by impressions | How well a pin turns views into visits |
| Total audience | Number of people who saw or engaged with your pins | How many people you reach (people, not views) |
| Engaged audience | Number of people who engaged with your pins | How many people actually did something |
| Video views | Views of at least 2 seconds with at least half the video on screen | Whether video pins stop the scroll |
Two details trip people up. First, impressions count views, not people. If one person sees your pin three times, that's three impressions but one person in your total audience. Second, outbound clicks are only counted from the date a link was added to a pin, so a pin you edited to add a link later will show fewer clicks than you might expect.
You'll also see follows and profile visits on individual pins. They're nice to know, but followers have little effect on who sees your pins now. Search does, which is why Pinterest SEO matters more.
How Pinterest numbers fit together: an example pin
Think of your numbers as a funnel. Lots of people see a pin, fewer interact, and fewer still click through to your site. Each step gets smaller, and that's normal.
Here's one pin with example numbers. It was seen 10,000 times (impressions). People engaged with it 400 times, so its engagement rate is 4%. Of those engagements, 120 were saves, 150 were pin clicks and 60 were outbound clicks. The outbound click rate is 60 divided by 10,000, which is 0.6%.
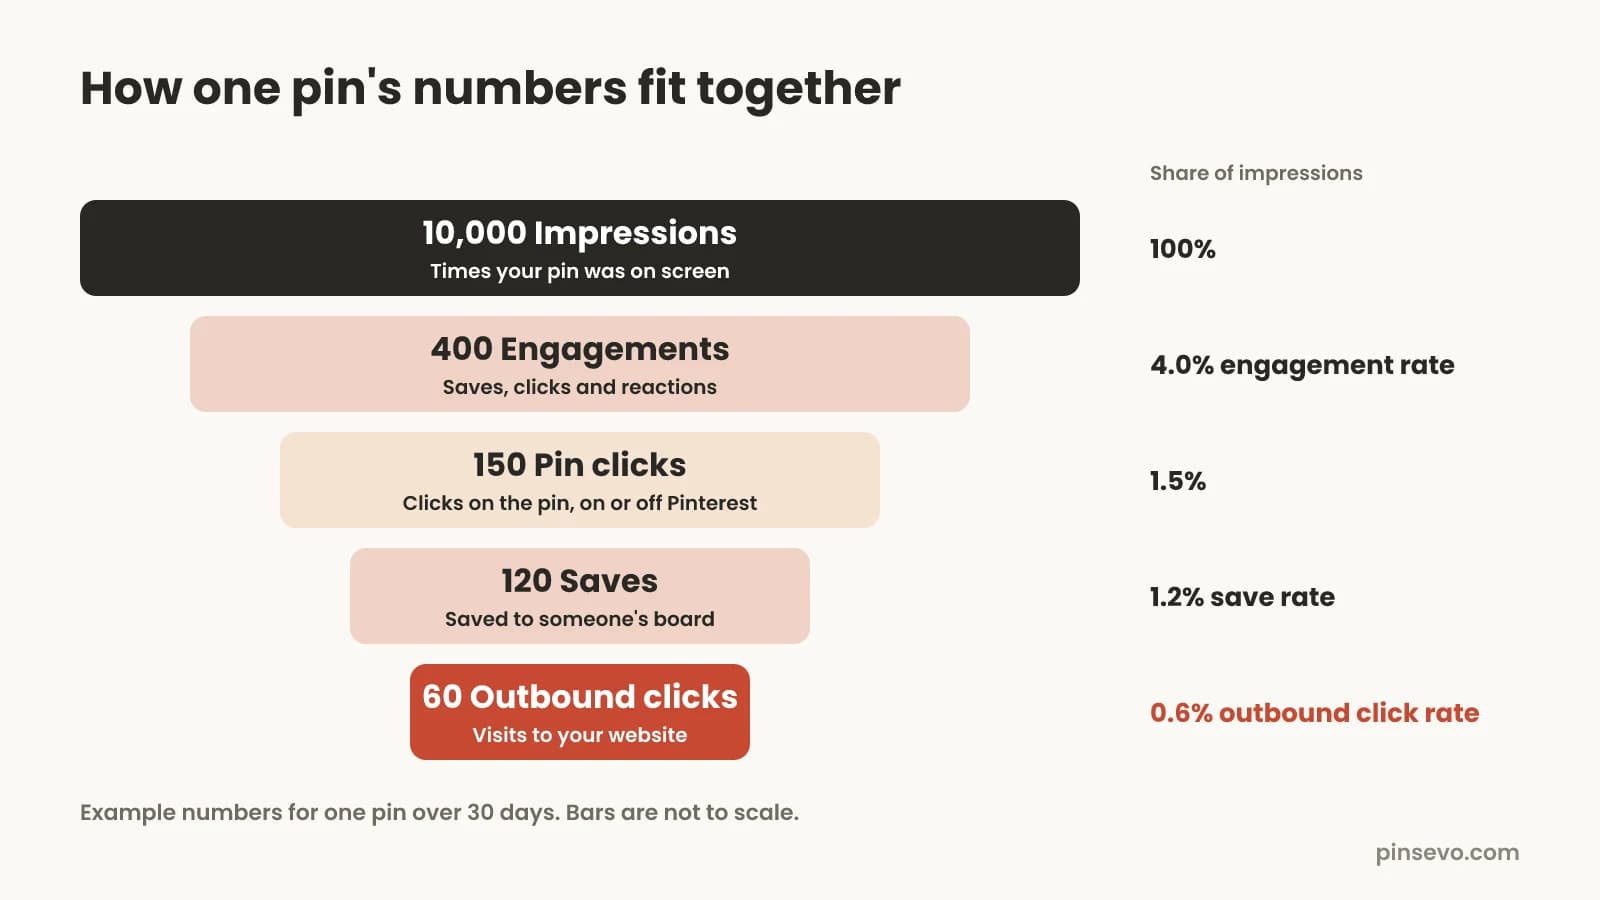
- Engagement rate: 400 / 10,000 = 4%
- Save rate: 120 / 10,000 = 1.2%
- Pin click rate: 150 / 10,000 = 1.5%
- Outbound click rate: 60 / 10,000 = 0.6%
Notice that saves, pin clicks and outbound clicks add up to 330, not 400. That's fine: engagements also include smaller actions like carousel swipes, so the parts don't have to add up to the total.
The useful part of this view is spotting where a pin leaks. High impressions but a low engagement rate means the pin is being shown but doesn't catch the eye: try a new image or a clearer text overlay. Lots of pin clicks but few outbound clicks means people are curious but not convinced to visit: make the title and description promise what's on the page.
Monthly views vs impressions: what's the difference?
Monthly views is the single number shown on a business profile. Impressions is the detailed count inside analytics. They measure similar things but not the same thing, so they rarely match.
Monthly views is a rolling total for the past month, and it can include views of pins you saved from other people's sites. Impressions in analytics follow whatever filters you choose. Treat monthly views as a shop window number: nice to show, useless for deciding what to fix. If it's missing on a new business profile, give it a few weeks to build up.
Filters, date ranges and how far back the data goes
Pinterest analytics lets you look back about a year and a half, and it shows real-time estimates for the last 48 hours. The default view is the last 30 days. Filters are where most of the useful answers hide.
- Date range: any custom range within the last year and a half. Compare year over year if your niche is seasonal.
- Real-time estimates: a toggle for the last 48 hours. These are estimates and can go down later, so don't panic over a dip that's only a day old.
- Content type: all, organic, or paid and earned. If you run ads, filter to organic to see how your free pins really do.
- Claimed accounts: see results for one claimed website or Etsy shop at a time.
- Device: mobile, desktop or tablet.
- Source: your pins, other pins, or all. "Other pins" are pins other people made from your claimed site, which is a good sign people like your content.
- Export: on desktop, the Export button downloads a CSV of whatever you've filtered, which is handy for keeping a monthly record.
Below the chart, Pinterest lists your top pins and top boards, sorted by impressions. Change the sort to outbound clicks or saves. The pins that send the most traffic are often not the ones with the most views.
Which Pinterest metric matters for your goal?
Pick the metric that matches why you're on Pinterest, and watch that one first. Chasing every number at once is how people end up changing everything and learning nothing.
| Your goal | Watch first | Also check | Good sign |
|---|---|---|---|
| Website traffic (bloggers) | Outbound clicks | Outbound click rate, sessions from Pinterest in Google Analytics | Outbound clicks rising month over month |
| Brand awareness | Impressions | Saves, total audience | Impressions and saves growing together |
| Sales (shops) | Outbound clicks | Sales or conversions from Pinterest on your site | Clicks rising and buyers coming from pinterest.com |
| Testing new pin designs | Engagement rate | Pin click rate, save rate | New designs beat your old average |
| Video | Video views | Average play time, 95% plays | People watch past the first few seconds |
For sales, Pinterest analytics only gets you to the click. What happens after that lives on your site. Your shop platform or Google Analytics tells you whether Pinterest visitors buy.
Saves matter for every goal. A saved pin sits on someone's board where it can be found again, which is why saves often lead to more impressions weeks later.
What is a good engagement rate or outbound click rate on Pinterest?
There is no single good number. Rates vary a lot by niche, pin format and how new your account is, and Pinterest doesn't publish official benchmarks. The best benchmark is your own average.
Rates you read online usually come from one tool's customers or one person's account. A recipe blog and a wedding sign shop will never have the same outbound click rate, so work out your own baseline and beat it.
- Set the date range to the last 90 days and filter to your own organic pins.
- Write down your engagement rate, save rate and outbound click rate. That's your baseline.
- Each month, sort your top pins by outbound clicks and note which ones beat your baseline.
- Look for patterns: image style, text on the pin, topic, board, time of year.
- Make more fresh pins like the winners, then check the next month whether your average moved up.
Say you run a 40-post craft blog. Your 90-day outbound click rate is 0.5%. One pin, a tall pin with a clear step-by-step photo and the text "easy yarn wreath", has an outbound click rate of 1.4%. That's nearly three times your average, so the lesson is clear: make step-by-step pins with plain, searchable text for your other tutorials.
Watch rates and counts together. A rate can jump just because impressions fell, with the same few clicks.
Audience insights and Pinterest Trends: the free research tools
Audience insights tells you who sees and engages with your pins and what else they're into. Pinterest Trends tells you what everyone on Pinterest is searching for and when. Both are free with a business account.
Audience insights lives in the same Analytics menu. It shows the last 30 days for your total audience or engaged audience, broken down by age, gender, location and device. The most useful part is affinities: the categories and interests your audience likes more than the average Pinterest user. If your home decor audience also loves gardening, that's a board worth trying.
Pinterest Trends (at trends.pinterest.com) shows search and save trends going back up to two years. You can chart a keyword, compare up to four at once, and see when interest starts climbing each year. It isn't available in every country, and the audience trends section only appears once your audience is large enough.
Trends is the best free way to time seasonal pins. If "christmas cookie recipes" starts rising in early October, your pins should be live a few weeks before that. Our Pinterest content calendar gives start dates for the big holidays, and our Pinterest keywords guide shows how to use Trends and the search bar together.
How to see Pinterest traffic in Google Analytics
Pinterest only tells you about clicks. Google Analytics (or your shop's own stats) tells you what those visitors did on your site. In Google Analytics 4, Pinterest visits usually show up under the Organic Social channel, with pinterest.com as the source.
- In Google Analytics 4, go to Reports, then Acquisition, then Traffic acquisition.
- Change the table to show Session source / medium, then search for "pinterest".
- Look at sessions, engagement time and conversions (or purchases) for that row.
- For finer tracking, add UTM tags to your pin links, like ?utm_source=pinterest&utm_medium=social&utm_campaign=fall-recipes.
Expect Pinterest's outbound clicks to be higher than the sessions Google Analytics reports. Pinterest counts the click on Pinterest. Your site only counts the visit if its tracking code loads, and some people leave before that happens, especially on slow mobile pages. A gap is normal. A gap that suddenly widens can mean a slow site or a broken link.
Why did my Pinterest numbers drop?
Most drops come from seasons ending, posting less, or the same old pins slowly fading. Real account problems are rarer. Before changing anything, check whether the drop is real.
- Compare to the same period last year. A food blog's impressions drop every January after holiday baking ends.
- Turn off real-time estimates and look again. The last 48 hours are often revised.
- Check outbound clicks, not just impressions. Fewer views with steady clicks isn't a real problem.
- Look at how many fresh pins you posted. A quiet month of posting usually shows up two to four weeks later.
If the drop is real and lasts more than a few weeks, our guide to why Pinterest impressions drop covers nine common causes and how to fix each one. Steady posting is the usual cure: our post on how many pins to post per day has realistic numbers for small accounts. If keeping up is the problem, Pinsevo can make fresh pins from your existing pages and post the ones you approve each day.
Pinterest analytics not working? Common fixes
When Pinterest analytics shows nothing, the usual reasons are timing, account type, or a website setting. Pinterest's analytics troubleshooting page says data can take up to 48 hours to appear, and a full week of data about 10 days after you switch to a business account.
| Problem | Likely cause | What to do |
|---|---|---|
| No Analytics option in the menu | You're on a personal account | Switch to a free business account in Settings |
| Analytics is empty | You switched recently | Wait: data starts about two days after switching, older history isn't available |
| Yesterday's numbers look wrong | Data delay or real-time estimates | Check again in 48 hours, or turn off real-time estimates |
| No data for your website | Website not claimed, or it redirects to another address | Claim the exact address your site uses, with or without www |
| Few saves counted from your site | Third-party save button on your site | Pinterest only records data from its official Save button |
| Pinterest clicks don't match Google Analytics | Different ways of counting | Normal. Watch the trend in each tool, not the exact match |
| Audience insights or Trends missing | Audience too small, region, or using the app | Open it in a browser and keep posting; some parts need a larger audience |
| Monthly views stuck or missing | It needs a full month of data, or a display delay | Give it a few weeks before worrying |
If none of these fit, try a different browser and check Pinterest's help center for known issues. Glitches happen, and they usually clear up within a few days.
A 20-minute monthly Pinterest analytics review
Once a month, set a timer for 20 minutes and go through the same steps. Doing it the same way every time is what makes the numbers useful. Checking daily mostly creates worry.

- Open Analytics on desktop, set the date range to last month, and filter to organic content (2 minutes).
- Write down impressions, saves, outbound clicks and outbound click rate next to last month's numbers (3 minutes).
- Sort top pins by outbound clicks and note the top five. What do they have in common? (4 minutes)
- Sort by saves and note any pin that's being saved a lot but rarely clicked. Rewrite its title or make a new version with a clearer reason to click (3 minutes).
- Check the claimed accounts and source filters to see whether other people are pinning from your site (2 minutes).
- Open Google Analytics and note Pinterest sessions and sales or signups (3 minutes).
- Glance at Pinterest Trends for next month's rising searches in your niche (2 minutes).
- Pick one thing to do more of next month, like "make two new pins for each of my top five pages" (1 minute).
That last step is the whole point. Analytics should end in one clear action, not a page of notes. Most months the action is the same: make more fresh pins for the pages that already work. If you'd rather not make them by hand, Pinsevo turns those pages into new pins with searchable titles for you to approve.
Keep your monthly numbers in a spreadsheet. After a year you'll know your seasons, which is worth more than any benchmark. For what drives those numbers, read how the Pinterest algorithm works.
Quick answers
How do I see my Pinterest analytics?
Switch to a free business account, then open the menu at the top left on desktop and choose Analytics, then Overview. On the app, tap your profile picture, the chart icon at the top of your profile, then Analytics.
Is Pinterest analytics free?
Yes. Pinterest analytics, Audience insights and Pinterest Trends are all free with a business account, and the business account itself is free.
Can I see Pinterest analytics on the iPhone app?
Yes. In the Pinterest app on iOS or Android, tap your profile picture, then the chart icon, then Analytics. Exporting, audience comparisons and age and gender filters need a browser.
What is the difference between impressions and monthly views?
Impressions in analytics count how often your pins were on screen in the date range and filters you choose. Monthly views is a single rolling number on your profile that can include pins you saved from other sites, so the two rarely match.
What is a good outbound click rate on Pinterest?
Pinterest doesn't publish an official benchmark, and rates vary a lot by niche. Work out your own 90-day average and aim to beat it with each new batch of pins.
Why is my Pinterest analytics not showing any data?
Data can take up to 48 hours to appear, and new business accounts get about a week of data roughly 10 days after switching. History from before you switched isn't available.
How far back does Pinterest analytics go?
About a year and a half for custom date ranges, plus real-time estimates for the last 48 hours. Pinterest Trends shows search trends up to two years back.
What is the best Pinterest analytics tool?
Start with Pinterest's own analytics plus Google Analytics for what happens on your site. Both are free and cover what most bloggers and small shops need.